The public reports listed below are examples of data visualizations currently being used at Ohio State.
If you have a disability and need to request Tableau data in an alternative format, please email the Data Visualization team.
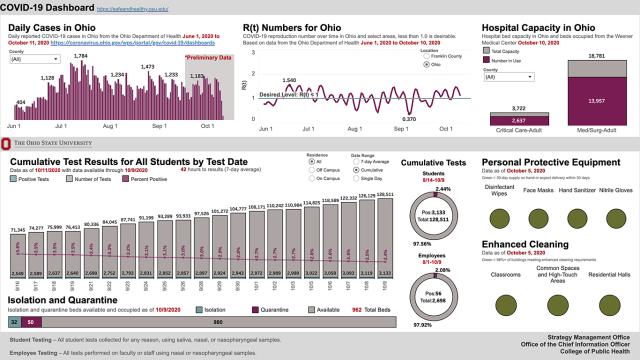
COVID-19 Dashboard
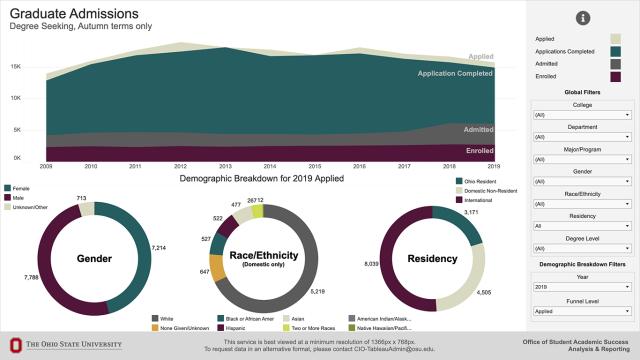
Graduate Admissions
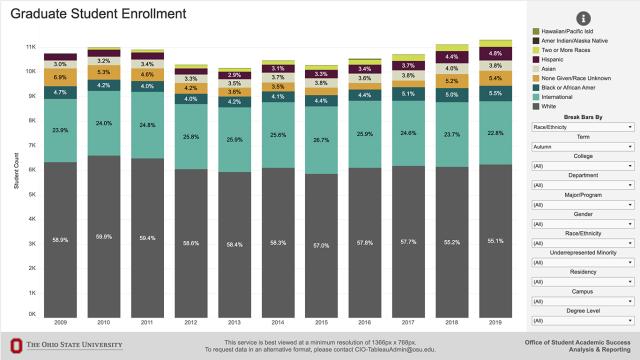
Graduate Student Enrollment
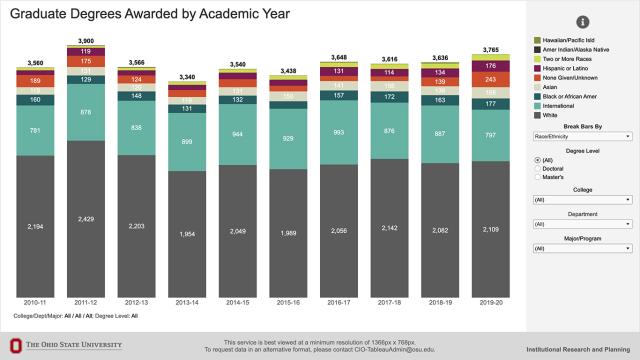
Graduate Degrees Awarded by Academic Year
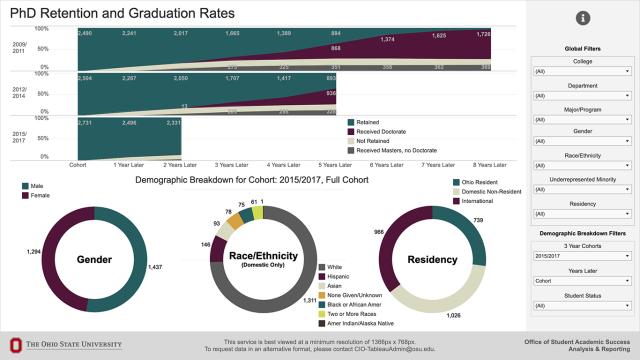
PhD Retention and Graduation Rates
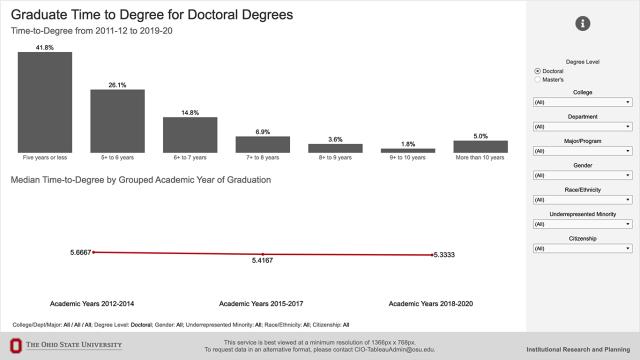
Graduate Time to Degree for Doctoral Degrees